Thursday, August 16, 2018

Week 6 Friday (Presentation Day)

Image result for guy giving presentation
The Internship has finally come to an end, so these blogs will be coming to an end now as well. I had a great time with my fellow interns, who were all really fun to be around.

Thank you to Joe Pow for having the CIS Internship program and for running the hockey analytics lab. You helped us overcome all the problems we faced during our research.

Now for next year's interns: make sure you find a more expensive place to go to lunch when the imaging science center is paying for it. Start at the most expensive place and work your way down. Then, take advantage of this exceptional meal which you earned with some great negotiating. Make the best out of this opportunity.

Week 6 Wednesday and Thursday

On Wednesday, we went out for lunch on CIS's tab. Then, we had our mock presentation, and our presentation seemed to go pretty smoothly, so there weren't many corrections to make.

On Thursday, I went over the presentation by myself, practicing my lines and fine tuning anything I though wasn't clear enough. Overall, we are done for Friday.

Tuesday, August 14, 2018

Week 6 Tuesday (Presentation)

     Hockey Analytics Lab
We practiced our presentation today. I will need to change the wording of a couple of slides, in order to explain the challenges we faced and the manual components. Otherwise, it went quite smoothly and we look prepared for Friday.

Monday, August 13, 2018

Week 6 Monday (Presentation)


We spent a lot of time in the morning going through the presentation. First, we did a complete practice run, where Joe timed how long it went. After giving us some general comments, we went through slide by slide, adding in some information and reminding ourselves of certain comments we must make in order to ensure that the story is complete and clear.

I changed one of the screenshots into a video, and I edited appropriately. I also redid the calculations for player identification in order to not account for the numbers on the sleeves, as Joe warned that those are not clear enough to use. I made a couple other edits, but now it is just back to practicing. 


Friday, August 10, 2018

Week 5 Friday (Power Point)


I presented the Power Point in the morning to Joe, and we found a few kinks that needed to be worked out. I cut the videos appropriately, and then I reorganized those slides to have better flow. We made some more changes to the conclusion slides as well. After, that it was just reading it through.

Thursday, August 9, 2018

Week 5 Thursday (Power Point)

    
We went over the power point in a pseudo presentation this morning. Emma and I realized that we needed to add more speaker notes, and we also found a couple of places where the story gets choppy and needs reorganizing or additional slides.

I also filled in some gaps that we had in our presentation. I added in some broadcast film, as well as fixed focal length camera film into our introduction. We plan on using that information in order to explain the differences between the two systems.

Joe also found a power point that showed image translation very well in one of the slides. I will use that slide in order to depict that translation, as it appropriately explains what the freshman did.

After adding in some more speaker notes, we should be ready to do a full on presentation practice. 

Wednesday, August 8, 2018

Week 5 Wednesday (Powerpoint)


I spent time working on adding images to the player identification portion of the power point today. I also went through the screenshots I used to find out what percentage of the players were in the broadcast frame on average. I realized that I accounted for the goalie as well, so I recalculated those measurements, and I added in more frames. I ended up finding that 56 percent of the players were in each frame.

Now, Emma, Joe, and I will simply work to ensure the legitimacy of our player tracking comparisons. 

Tuesday, August 7, 2018

Week 5 Tuesday (Powerpoint)


The next few days will be spent just working on putting the rest of the information and images into my power point. I went over a lot of the research that we did to make sure we covered everything we needed to have covered to tell a complete story. Any gaps will also arise as we make the power point.

I am completely done with putting information in bullets into the slides. Now, I will find the corresponding images to help explain those bullets. Then, I will need to really practice and make sure I have everything I need there.

Monday, August 6, 2018

Week 5 Monday (Powerpoint)


I spent the majority of my time working on the presentation and mainly organizing my thoughts as to what progress we have made over the past four weeks. I looked through the power point that the freshman made, and the image above was in that power point. It clearly depicts the placement of the cameras and what portions of the hockey rink that they each capture. We will use this image in our presentation, as that information is something we definitely need to convey.

There was other valuable information in that power point, which we will apply to our presentation. Other than that, I input information into the presentation, and I will add the images later. Some of the bullet points will need to be taken out, but I want to keep them for now to practice with.

Friday, August 3, 2018

Week 4 Friday (Research Symposium)

I spent the majority of the day at the research symposium. There was a poster presentation, where I saw presentations on anything from 3d printed prosthetic to the radar detection that we see in the image above. The presentations were all very interesting and in-depth, making it challenging to understand everything that was written on their boards. However, it was easy to see the purpose and progress of the individual researchers. I also gained some valuable knowledge I can utilize in my presentation in a couple of weeks.

There was some in person presentations that I witnessed as well. They were on the relationship between space matter density and star production as well as the merging of the stars. This one was very hard to understand, but all three researched gave different presentations on the issue with some overlap.

When I came back to the lab, I spent some time looking into MNIST, but now my next focus is just on confirming whether or not pixels are the best thing to use to compare the broadcast system and the fixed focal length system. I am waiting for a response back from Mike, but I will continue working on the power point in the meantime.

Thursday, August 2, 2018

Week 4 Thursday (Finalizing Data)

Image result for pixel counting

I had to analyze the data from the previous two days. I did this by finding the average number of pixels in each clipping that could be used to find the jersey number. I did this for the broadcast system and the fixed focal length camera system. After compiling the data, I found that on average there were about 209 more pixels per frame for the broadcast system. However, after closer inspection, it became clear that this difference was due to a multitude of 0 pixels in the fixed focal length system, potentially due to the angle of the camera. Comparatively, there were almost no situations in which 0 pixels were present for the broadcast system.

However, only 50 percent of the hockey players were in each frame, so this trade off must be accounted for in the final analysis of which system is better for player analysis. Now, I will work more on my power point presentation, but if any problems arise with the accuracy of the data, I will have to refer back to my calculations.

Wednesday, August 1, 2018

Week 4 Wednesday (Testing)


After working out the kinks in the method of comparison yesterday, today was simply spent working on finding and analyzing the data. I took about 30 frames from the set of fixed focal length camera data that is not filtered. The filtered data is what the RIT freshman had used to calibrate the system, so the numbers on the back of the jerseys are visible to the human eye. Using that data would inherently have skewed the data, making it seem like there are more pixels revealing jersey number than there really are.

Thus, I utilized the unfiltered data. I ended up using the clippings of other teams. This decision should not matter as the numbers are placed in the same location, and for our pixel analysis, should not vary based on team. I used the bounding polygon box on Image J and searched how Image J can find the area inside the box. Pressing [M] allows numerous data values to be shown in a results window. One of those data values is the area. I finished calculating the pixel values for the broadcast and fixed focal length camera systems for 30 frames each. Now, I will determine if that is sufficient data and the differences between the two systems.

Tuesday, July 31, 2018

Week 4 Tuesday (Programming)

Image result for python image processing

The same issues from yesterday carried over to today. Thus, I needed Ethan's help to ensure the python program was able to grab the folders of image clippings and produce results that I could use to compare the broadcast system with the fixed focal length system.

Ethan went through the program and was able to solve many of the syntax errors and work with the program to make sure it was grabbing images from the appropriate places. During this process, he taught me quite a bit about directories. He explained that they are the places where the program is looking for the input. 

He determined that the program didn't actually find a percentage accuracy, but rather was supposed to produce images that has numbers written above them to indicate the jersey number that the computer was recognizing. Joe concurred that this was the purpose of the program.

Even after fixing the program for our specifications, the program didn't seem to accomplish any task. In fact, the original image was the same as the returned image. Thus, the program was not functional for comparing the broadcast and fixed focal length system. Due to time constraints, it became infeasible to write new code that would find specific percentages or return images with the predicted jersey numbers. In fact, finding specific percentages would require the numbers on the players to be read manually. Not all of the clippings have that quality, so using such a method would skew the data.

Therefore, we decided that I should simply work on finding the pixels that make up the numbers on each jersey. Now, I will go through image J and the two sets of clippings to find this data. 

Monday, July 30, 2018

Week 4 Monday (Troubleshooting)

Image result for tif file

I had the same difficulties that I had on Friday with the program. I looked through the folder and the wiki to see if there was any documentation I could use to help solve the problem, but I remained at a logjam. I looked back in the folder where I found the previous code, and I realized that there were three programs that the freshman made. However, I believe only one is necessary to find the accuracy that the program can identify players with.

Ethan was able to come in and help after lunch, but he spent quite a bit of time helping Emma. Thus, he didn't have enough time to help solve the problem I had. She had some problems with her syntax and with the format that her photos were in, so I tried correcting the photos from Tiff to PNG. That was the correction Ethan did for Emma at large, solving her issues. I wasn't able to do them all at once, so I will have to wait for him to help me do them all at once.

All in all, I should be able to run my program quickly if I can fix the program and access my folder of pictures appropriately. However, this seems to be a sizable problem. 

Friday, July 27, 2018

Week 3 Friday (Python Problems)

Image result for python code

The issues I had today began with Python not working as intended. I have limited experience using the coding language, so I was unaware of how to implement the code specifically with the photo clippings. I noticed a location where I could input the file name, but when I tried to do so, I received an invalid syntax error.

I spent some time playing around with the system, but I required the help of someone more experienced. Emma had previously emailed Ethan about receiving his expertise with the program she was using, so I sent another email to Ethan asking him to help me with the problems I am dealing with. I guess I will have to wait until Monday for his aid.

During the rest of the day, I spent my time watching Hudson and Emerald creating their mosaics. I even got the opportunity to watch Emma mosaic a couple of the photos that Hudson had. I learned from this experience, but today was mostly a slow day, due to the roadblock with the coding.

Thursday, July 26, 2018

Week 3 Thursday (Creating Clippings)


There was no staff meeting today, as Joe had a different place to be at. Thus, I began the day by simply working on creating screenshots from the three fixed focal length camera. I then followed that up by taking clipping of the jersey area for all the players on the ice. I was planning on running those clippings through the python program that Joe found yesterday. I finished making quite a few clippings, but then I realized that I didn't need to make those clippings because the freshman had already taken those cutouts during their time working on the project.

Thus, I switched focus after lunch. I went back to the screenshots I used a couple of days ago to find the percentage of players in each frame. I went back to the source broadcast video and got some more screenshots, so that I could have more jersey clippings to compare with the three fixed camera clippings.

Then, I spent the remaining time in the day working with those screenshots. I used image J to draw a box around that space that I wanted to save. I then duplicated that area and saved it as a file, creating the appropriate clipping. In the next few days, I will analyze those clippings to determine if the broadcast system produces more accurate player identification

Wednesday, July 25, 2018

Week 3 Wednesday (Planning out Progress)

Image result for numbers on back of jerseys

We began the day by going over the outline for our presentation. We decided that when telling it like a story, we should go through what the freshman did, looking at their objectives. Then, we will move to our task, comparing the broadcast and fixed focal length system on a broad basis. After that, we will specifically compare the two systems in the sense of tracking players, identifying the team of the player, and also the name of the player. Finally, we will discuss the future ways in which we can take this project.

After that planning, I began working on the specific player identification. I couldn't find any specific code on this matter, so I decided to make best guess judgments as to whether or not the number could be identified. I also realized that the pixel calculations from before were only the pixels on the computer screen, as I was taking screenshots and then inputting the image into image J. Thus, I redid the calculations looking at stills from the video, finding that the fixed focal length camera system had almost a six times larger size than the broadcast system at 2092800 pixels.


I did some calculations on the broadcast film, finding that only 48 percent of the players were in each frame. The eyeball method proved to be quite inaccurate, so I really needed to find the code so that I could use that code to compare stills from both cameras. Joe was able to find that code for me. Hopefully it works, so that I can do the appropriate calculations.

Tuesday, July 24, 2018

Week 3 Tuesday (Player Identification)

I had to first recognize what the freshman had done with their project in order to compare it to the broadcast system. Yesterday, I figured out the number of pixels in a screenshot. It turns out that that number of pixels is the same number for a screenshot on the broadcast footage. Thus, if we were to compare the two in the sense of pixel count, there would be no difference. However, the things that will come into effect are the number of players that are in each frame (when randomly selected), and also how much the camera is zoomed in (only broadcast footage could zoom in).

If I can find solid numbers here, then I can compare the two systems and conclude upon what system we believe is best suited for this task. I looked through the information on the computer to see if there was any other information I could find to compare the two systems. However, there was no code I could find for the identification of which players was which. In fact, I could not even find any histograms detailing their data, so I guess I will simply have to look to my method of comparison.

Later, I started to spend some solid time thinking about the similarities between Tyler and Benedict Cumberbatch. In fact, I even found the courage to ask him about that similarity, because it truly is uncanny. You should take a look for yourself.

Monday, July 23, 2018

Week 3 Monday (New Task)


After last week's progress with comparing the broadcast system to the fixed camera system specifically on the task of locating players, these next two weeks will be dedicated to working on figuring out which system is better for team identification and player identification. I will be specifically working on the player identification part of this task.

It was hard today to find a good place to look for information that I could use to compare the two systems, so I spent the majority of my time looking through the files on the computer and the Wiki. I found a histogram that charted the colors of RIT jerseys, so that would provide very valuable information on team identification.

I decided that the main thing when looking for player identification would follow a similar vein of thought: pixel count. Thus, I used Image J to find out how many pixels were present on the fixed camera system. All three cameras are at the same point with the zoom remaining unchanged. I found that they each had 2073600 pixels in each frame.

To appropriately compare this to the broadcast footage, I must find how many pixels are present on each frame of that footage. I must further adjust the values to account for how zoomed in the camera is, as that should allow for more pixels on the same amount of fabric versus when the camera is not zoomed in. I must also account for the fact that not all players are visible in each broadcast frame to determine which method is more suitable.

Friday, July 20, 2018

Week 2 Friday (Analyzing Data)

Related image
I realized that I had forgot to write down the coordinates, as calculated by the freshman's model. I had simply done the math that found the difference between their coordinates and the exact coordinates I had found. Thus, I began the day by redoing those calculations to ensure I had the adequate data to refer back to in case I needed to do some more analysis or verify the accuracy of my calculations.

I finished analyzing all my data once this was completed, and I found some pretty clear results. Although, I recognize that there were inaccuracies in finding the supposed "exact location" on the ice, due to the inherent angle that the camera was placed at. However, I tried to account for this issue by using multiple scales to decrease the error that was present.

Either way, I found from 31 frames over a span of 2 minutes and 35 seconds that our program was on average a little over 1.58 feet more accurate than the freshman's coordinate mapping. This difference was quite noticeable during many situations where their projection had players that were actually inside the center circle placed outside of it.  Thus, I think it is fair to conclude that the method of mapping we are implementing is more accurate, but we would have to ensure that this conclusion is not the result of the aforementioned error. Now, we might have to consider why this method is more accurate.

Thursday, July 19, 2018

Week 2 Thursday (Our Program vs Location)

Image result for distance between points measurement
Continuing on with the work from yesterday, I had to compare the exact location of a point on the ice to the location that my program predicted. Because the camera was always in the same frame, I could use the same four reference points to determine the predicted location of a common point. I used the same common points that I used to compare the ice rink perspective with the map of points that the freshman created. These points were almost always locations of the players on the ice.

I used the same scaling method as I did yesterday to determine where the hockey players really were, at least according to the video feed. Once I figured out the exact coordinates of that point on the ice, I would input the corresponding image J point and all the reference points in order to find out where my predicted point was. Now, I was able to find the distance between these points using a distance between coordinates calculator. Next, I will compare the difference between how far off my program and the freshman's program were.

Wednesday, July 18, 2018

Week 2 Wednesday (More Computer Testing)

Today, we were once again tasked with calculating the variation from the exact location to the location that the previous program was calculating, as well as to the method that we were implementing. Although the camera was in a constant position for the entirety of the video clip that we were analyzing, we utilized the same methods that we would have used for a broadcast film with a moving camera. Thus, we truly are comparing the three fixed focal length camera to the broadcast system.

I finished my measurements that compared the exact location to what the freshman's program predicted. I used a ruler to determine a scale in the x and y directions for both images shown above. Then, I used these values to find coordinates for the location of a single person in both frames, with the same origin. Then I calculated the distance between these coordinates to find how far off the freshman's calculations were.

I am done with that process, so I now have to begin calculating how far off our predictions are. We once again use a scale to find the exact coordinates, and we used Image J to find the predicted coordinates. It is hard to remain unbiased in this process, but we must in order to ensure the accuracy of our data.

Tuesday, July 17, 2018

Week 2 Tuesday (Testing with Program)


We began the day by going over our individual progress during the staff meeting. I was still struggling with getting the program to work.

Thus, I began the day on that task. I commented the latter steps of the code in order to go through each of the steps to find which part of the code was the problem. I found that the problem was in the equation solver. The second matrix that I was creating from the hockey rink perspective repeated the variables from the first matrix. Thus, when I was accessing the variables that the equation solver was creating, I was accessing the same variables each time. Thus, the final answer was different from what I had found when doing the math by hand.

After letting the rest of the code play out by itself, the answer that I got from the program was actually accurate, contrary to the inaccurate calculations I had done by hand. It seems that the online calculator was not doing it correctly, or I didn't copy over the data properly. Either way, it is good to see that the program is finally working.

I continued using this program to test various frames from the broadcast footage. However, after speaking with Joe, it became evident that in order to truly compare the three fixed focal length camera system with the system we were testing, it was better to utilize the same frames that the freshman had tested. Thus, we could compare our results with theirs and determine who had more accurate results. We will continue to work on these calculations for the next few days.

Monday, July 16, 2018

Week 2 Monday (Reading)

Image result for Multiple view geometry in computer vision
Today I started off the day with reading a book that outlines the math we have been working with during this project - Multiple View Geometry in . . . by Richard Hartley. Our math has not been working during recent days, making it very difficult for us to decide whether or not the broadcast system is feasible. In order to determine this, we have to get results that indicate we are are doing the calculations properly, even if they are not 100 percent accurate. The accuracy is something we will compare to the three focal length camera later. In addition, we know that this math has been proven before, so there must be a mistake in what we are doing.

Carl explained to us that we were doing the inverse of the wrong matrix. This realization helped us clear up on misconception that will hopefully help us get accurate results in the future.

Furthermore, I found a paragraph in the book which discussed the differences between Euclidean transformation and affine transformations. Both could contian a transformation and rotation of the origin; thus, I though that we needed to use the same origin on the Image J and the Ice Rink perspective in order to get accurate results. This conclusion was something that I had previously arrived upon as well. However, Emma was able to complete one test that was accurate, indicating that the math was done in the proper manner. She didn't use the same origin, so that theory for the error has been discarded.

This test was the only one that had accurate results, even with the appropriate matrix inverse, forcing us to search for our mistake once again. I decided to move onto working on the program. I went through the mathematical steps, and everything seems to be in order. However, the results are not what I get when doing the calculations by hand. I completed another inaccurate test of a broadcast frame, and I will use this frame to at least find the error in my program.

Friday, July 13, 2018

Week 1 Friday (Ice Skating)

Image result for ice skating
Anoop Sunkara (seen on the right hand side) performs a triple axel.

During the staff meeting, we went over the abstracts that we wrote yesterday. After spending some time to correct the abstract for the hockey group, adding in background information about analytics and our goals, Emma and I went to Frank Ritter Arena to take some measurements of certain reference points on the ice that we didn't have. We measured a lot of key points on the tiger head and on the four dots that lie at each corner of the arena. However, we  are concerned about the accuracy of those measurements due to the fact that Frank Ritter Arena is different from the main stadium that the RIT hockey team plays at.

After coming back to the laboratory, Joe, Emma and I spoke about the results from the data yesterday. We considered using certain advertisements as reference points. However, we can't access them due to the fact that the main Gene Polisseni center doesn't have any ice in it as of now. We also considered using the lines that are around the four dots on the four corners. However, we questioned whether or not a computer would be able to automatically recognize these points. Before we answered these questions about the capability of a computer to automatically categorize the data, we needed to ensure that we could do it accurately manually. Thus, we performed some more tests with data points and a new origin to see if that would correct the inaccuracies. It did not, so we need to talk with Carl to understand how we can do the math accurately.

After that, we went to the ice rink and had fun ice skating. I could not get my shoes on properly, so someone had to tie my shoelaces for me. That was quite unfortunate. We missed out on the free pizza, but we had lunch after ice skating.

When we got back, I worked on getting more data for the excel chart I worked on yesterday. It seemed like the accuracy was increasing, but I will have to get more data to see if it really is higher than the 48 percent I had yesterday. I got a new chair today too, so that was definitely a plus.

Thursday, July 12, 2018

Week 1 Thursday - (Video Analysis)

We started off the day with our usual staff meeting. Emerald and Hudson explained the work they were doing with document restoration. Afterwards, we made a plan for the hockey analytics group.
Our goals became to compare the broadcast feed to the three focal camera system. We needed to look at the accuracy of each in locating RIT players and naming them. We decided that we should also consider any challenges that might be present with the broadcast system.

I first worked with my program from yesterday, and I believe that it is now functional. Then, I went through all the files that the freshman had created. There were numerous files to go through, but I was specifically looking for files related to the accuracy of the three camera system. I copied these into another folder for analysis later.

In accordance with these, we had to analyze the broadcast film to determine the feasibility of pursuing this method. We needed four reference points for an accurate translation, so we had to determine if these four points could be found manually and automatically, using different data sets. After watching some game film, I found that there was always four known reference points that could be manually located. However, there was only four reference points that could be automatically located 48 percent of the time. Now, we must consider the feasibility of pursuing this method.

Wednesday, July 11, 2018

Week 1 Wednesday - (Testing out Math)

Image result for matrix multiplication

After learning some very valuable information from Carl yesterday, we tried to test out the different frames that we had with the method that he taught us.

I took a given frame in Image J, and then I found four reference points that we knew the exact coordinates on the ice of. I wrote down the coordinates according to Image J, which were the pixel dimensions. We wrote down the known dimensions according the previous freshman's measurements, centered around the origin. As I know think about it, it seems inappropriate to do so, as those are centered around something different than what the Image J coordinates were centered around.

Anyway, after doing all of the necessary math, we used another reference point on our broadcast frame to check if our work was accurate. However, when using that point, the predicted coordinates in the hockey rink frame were completely different than what we had based on the measurements.

This result may be due to the orientation being different, as previously stated, or due to inaccurate measurements from before. Looking at a regulation hockey rink, it seems that the measurements were not correct; we will verify this on Friday when we measure the rink ourselves. We must also correct our orientation.

Next, I worked on creating a code in Matlab to complete the math with just the inputs. I had to do some research online as to how to use the programming language, but after that I was good to go. I will check the program's final accuracy tomorrow (already checked certain portions of the program).

Tuesday, July 10, 2018

7/10/2018 Week 1 Tuesday (Mathematics for Image Translation)

Image result for hockey rink

Today was spent with a lot of computer time. We had our daily staff meting and Joe spoke with us about the blogs. After that. we had a lecture from Carl, who explained geometric transformations from photos onto hockey rinks. Unfortunately. he had a 9:15 meeting, so he had to leave midway.

I went on to research Image J, and I added a couple of extensions to to analyze the image. However, they didn't perfectly lay it out as a hockey rink. I tried to do the same thing in Photoshop, but once again it proved to be ineffective. We decided that lines were not good reference points because of the lack of a clear location.

When Carl came back, he explained that our reasoning was accurate, and that we would need four points to translate the image. He then showed us two ways of finding corresponding points. There was some middle plane that we had to convert to first, and then we could covert to the corresponding point. We then checked out the Multiple View Geometry book by Hartley to learn more from.

Monday, July 9, 2018

7/9/2018 Week 1 Monday (Deciding Goals of Internship)

Image result for hockey rink ritWe began the day with our staff meeting, where we went over our individual assignments for the day. After that, Joe, Emma, and I had a group meeting where we went over the progress that the freshman made with the project. Furthermore, we brainstormed as to what our goals would be for the internship. We decided that we had to answer two questions: "is it feasible to use the broadcast video? "and "Is it most effective to use the broadcast video to instantly categorize the date?"
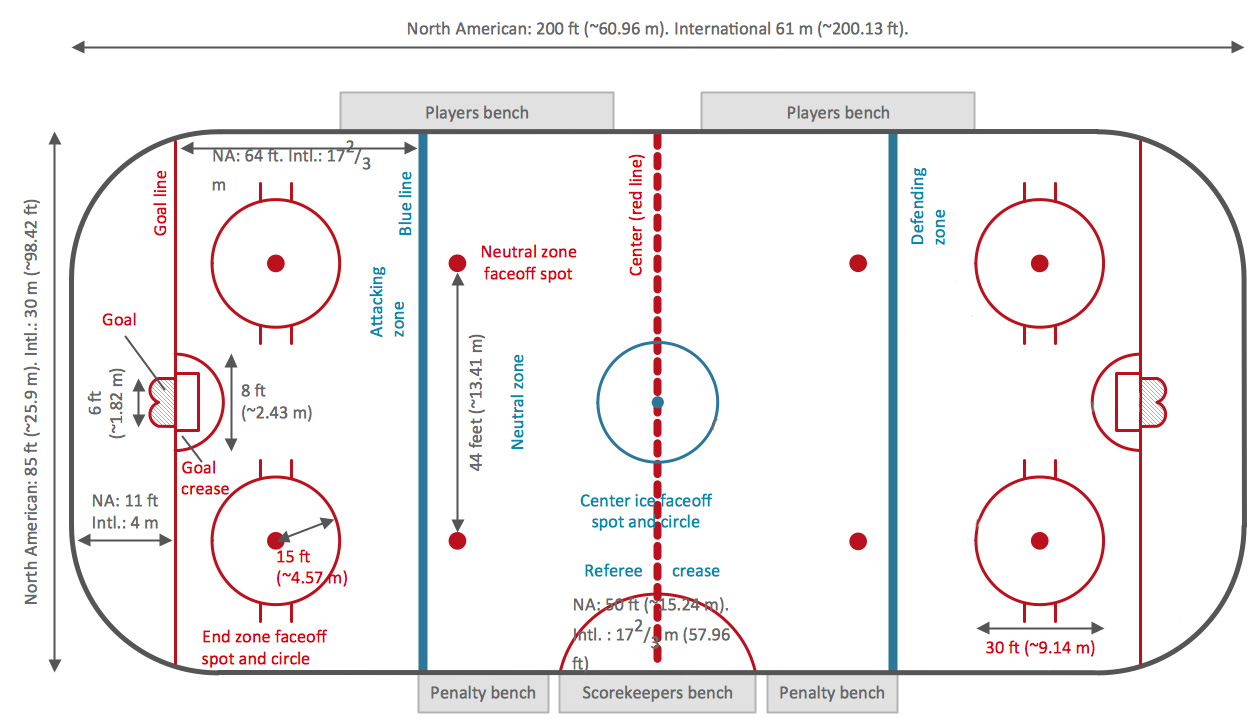
In order to answer these questions, Emma and I first had to get Wifi on both the computers that we were using. I emailed CIS help, and they provided me with Wifi. While waiting for them, we realized that there were at least 18 different reference points that could be used to determine locations of the players and the puck. We thought that the eight lines, which are split into four figures, centered around the dots on the four corners could also be used as reference points. That makes another 32 reference points, creating a total of 50 reference points.
With this newfound knowledge, we looked at the broadcast film from RIT vs Bentley. After watching the entire game, it became clear that there we no frames, of the 215,784, that didn't have at least one reference point in it. We then realized that to get an adequate x and y coordinate for everything we desired, we needed at least two reference points to compare, allowing us to put the rink in perspective.
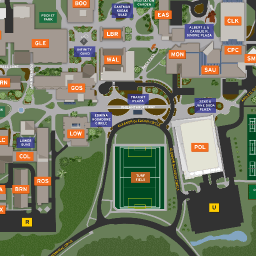
Now, I watched some videos on Fiji and learned how to analyze the frames on the film. We next went down to Ritter Arena and received the cell phone number of the ice rink operations manager. I gave him a call and set up a 9:30 appointment on Friday to measure the 32 lines that were previously not measured.

Friday, July 6, 2018

7/6/2018 - First Day (Scavenger Hunt)

Image result for rit map
Today was the first day of the internship. We met in our home base, which is the freshman imaging laboratory. We then walked over to receive our RIT ids, so that we could check in and out of the different rooms in the Carlson building. Next, we went to campus security, so that we could get parking permits for the people that were driving everyday. We then spent the rest of the day working on a scavenger hunt as a group.
We had to take videos of as many of the places/people, and we would get points for finding them and for the quality of the compiled video. Emerald stayed in the lab and worked on editing the video files we sent over. Emma and I worked on finding the various locations around campus, while Hudson and Michael worked together. Emma and I had great success finding the Dean of the science building. However, the Assistant Dean was working from home, so we could not get the points for meeting her.
We also found a bunch of other cool places in and around RIT and interviewed random people from across campus. We even interviewed someone who working in a Café. Then to top it all off, we scheduled an interview with the President of the University, and he spoke with us for a couple of seconds. That was crucial in getting the necessary points to earn ourselves a free lanyard!
After coming back to the Carlson building, we got a quick tour. Unfortunately, I was hit with a parking ticket on my way out. It seems like I will have to deal with that on Monday.